
In an era defined by unrelenting digital expansion, data centers stand as the unsung pillars of our connected world. These sprawling complexes of humming servers power everything from streaming platforms to artificial intelligence, quietly enabling the conveniences we take for granted. Yet beneath their technological marvel lies a stark environmental reality: data centers are voracious consumers of energy and water, straining resources at a scale that few fully grasp. As the demand for computing power surges—propelled by AI, cloud storage, and cryptocurrency—their footprint grows, raising urgent questions about sustainability in a warming world.
This article delves into the intricate interplay of energy and water usage in data centers, drawing on the latest research to reveal their past, present, and projected impact. From the cooling towers that guzzle billions of liters to the power grids feeding their insatiable appetite, we uncover the numbers, the innovations, and the trade-offs shaping their future. This is not just a story of technology but a reckoning with the hidden costs of our digital lives—and a roadmap for what comes next.
1. Introduction
1.1 The Importance and Environmental Impact of Data Centers
Picture a warehouse-sized labyrinth of blinking lights and whirring fans, its servers processing billions of transactions every second. Data centers are the beating heart of the internet, housing the infrastructure that supports modern life. In 2022 alone, they handled an estimated 460 terawatt-hours of electricity worldwide—a figure dwarfing the energy consumption of entire nations. Yet their rise comes at a cost. The Department of Energy has warned that U.S. data center energy use could triple by 2028, driven by AI’s relentless hunger for computational power. Meanwhile, water—an often-overlooked resource in this equation—flows through these facilities in staggering volumes, cooling overheated machines and sustaining the electricity that keeps them alive.
The environmental stakes are immense. Data centers account for roughly 2-3% of U.S. electricity consumption today, a share that’s growing as digital reliance deepens. Their water use, both direct and indirect, exerts pressure on local ecosystems, particularly in arid regions where every drop counts. As climate change intensifies, understanding and mitigating this dual dependency has never been more critical.
1.2 Purpose and Scope of the Analysis
This investigation seeks to illuminate the full spectrum of data center resource use, from historical baselines to cutting-edge efficiency strategies. We’ll explore how much energy and water these facilities consume, why those numbers are climbing, and what can be done to curb their impact. Grounded in data from industry reports, government studies, and corporate disclosures, our analysis spans the United States and beyond, offering a global perspective on a challenge that knows no borders.
1.3 Methodology
Our findings draw from authoritative sources like the Lawrence Berkeley National Laboratory’s 2016 report on U.S. data center energy usage, the International Energy Agency’s 2025 projections, and firsthand accounts from tech giants like Google and Microsoft. Calculations extrapolate from industry benchmarks—such as Power Usage Effectiveness (PUE) and Water Usage Effectiveness (WUE)—to paint a detailed picture. The result is a synthesis of hard numbers and real-world context, designed to inform and provoke thought.
2. Energy Consumption Analysis
2.1 Historical and Current Data
In 2014, U.S. data centers consumed 70 billion kilowatt-hours of electricity—enough to power every household in New York City for over two years. That figure, representing 1.8% of national usage, marked a slowdown from earlier decades when consumption soared nearly 90% between 2000 and 2005. Efficiency gains in hardware and design tempered the growth, but the reprieve was temporary. By 2022, U.S. consumption had climbed to roughly 100 billion kilowatt-hours, or 2-3% of the total grid, according to industry estimates. Globally, the tally hit 460 terawatt-hours, a testament to the relentless expansion of cloud computing and big data.
These numbers tell a story of scale and adaptation. Hyperscale facilities—massive data centers operated by tech titans like Amazon and Google—now dominate the landscape, leveraging economies of scale to process more with less. Yet even as efficiency improves, the sheer volume of demand threatens to outpace progress.
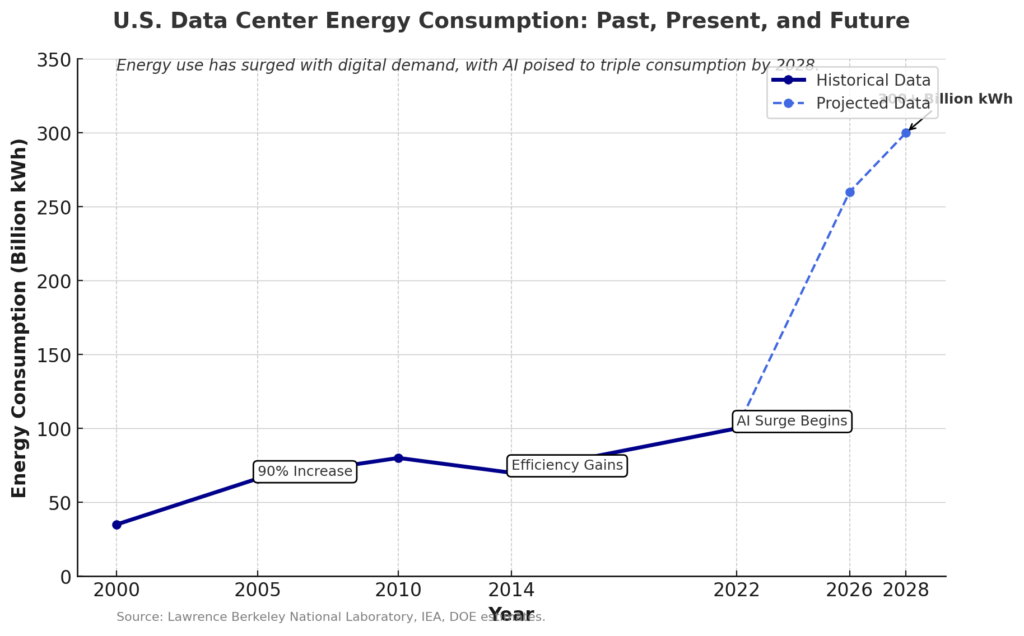
The line tracing U.S. data center energy use tells a tale of three eras. From 2000 to 2005, consumption nearly doubled, peaking at 66 billion kilowatt-hours as the internet boomed. A decade later, innovations like hyperscale designs pulled it back to 70 billion by 2014—a rare plateau. Now, with AI’s rise, the curve steepens again: 100 billion kilowatt-hours in 2022 could triple to over 300 billion by 2028. Each spike reflects a technological leap; each projection, a challenge to sustainability. As the graph shows, the future hinges on whether efficiency can outrun demand—or if the grid will falter first.
2.2 Future Projections
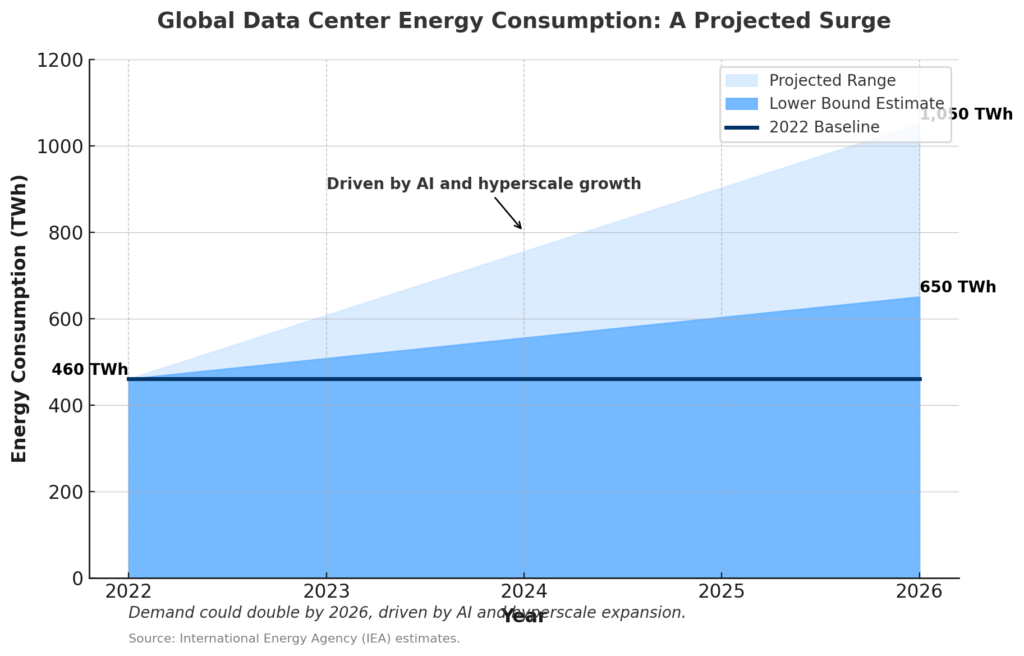
The horizon looks daunting. The International Energy Agency forecasts that global data center electricity use could double by 2026, reaching between 650 and 1,050 terawatt-hours. In the U.S., home to a third of the world’s data centers, the Department of Energy predicts consumption could hit 260 terawatt-hours by 2026 and potentially triple to over 300 terawatt-hours by 2028. The culprit? Artificial intelligence. Training a single large language model can burn through energy equivalent to powering dozens of homes for a year, and the proliferation of such systems is just beginning.
These projections aren’t mere speculation—they’re rooted in trends already underway. Cryptocurrency mining, hyperscale expansion, and the shift to edge computing are all accelerators, pushing power grids to their limits and raising concerns about reliability in an era of aging infrastructure.
2.3 Factors Influencing Energy Consumption
What drives this appetite? Start with the servers themselves. High-density racks designed for AI can demand 40-60 kilowatts each, compared to 10-14 kilowatts for traditional setups. Cooling systems, tasked with dissipating that heat, often account for 40% or more of a facility’s energy bill. Location plays a role too—data centers in Arizona’s desert heat battle higher cooling loads than those in Scandinavia’s chill.
Efficiency measures offer a counterweight. The PUE metric, which compares total energy use to that consumed by IT equipment, averages 1.5 to 2.0 industry-wide. A PUE of 1.5 means half the power goes to cooling and support systems—a figure that’s shrinking as operators adopt smarter designs. Still, the balance remains delicate, with every innovation tested by rising demand.
2.4 Energy Efficiency Strategies
The race is on to tame this beast. Liquid cooling, which pipes water or specialized fluids directly to server components, slashes energy use by leveraging water’s superior heat capacity. Free cooling, using outside air when conditions allow, thrives in cooler climates—think Iceland or Finland—cutting reliance on mechanical systems. Hardware advancements, like energy-sipping chips, trim IT consumption, while renewable energy deals, such as Google’s pledge to match 100% of its usage with clean power since 2017, redefine the grid’s role.
These strategies aren’t theoretical—they’re in action. Microsoft’s liquid-cooled data centers and Amazon’s wind-powered facilities illustrate a shift toward sustainability without sacrificing scale. The question is whether they can keep pace.
3. Water Usage Analysis
3.1 Direct Water Usage
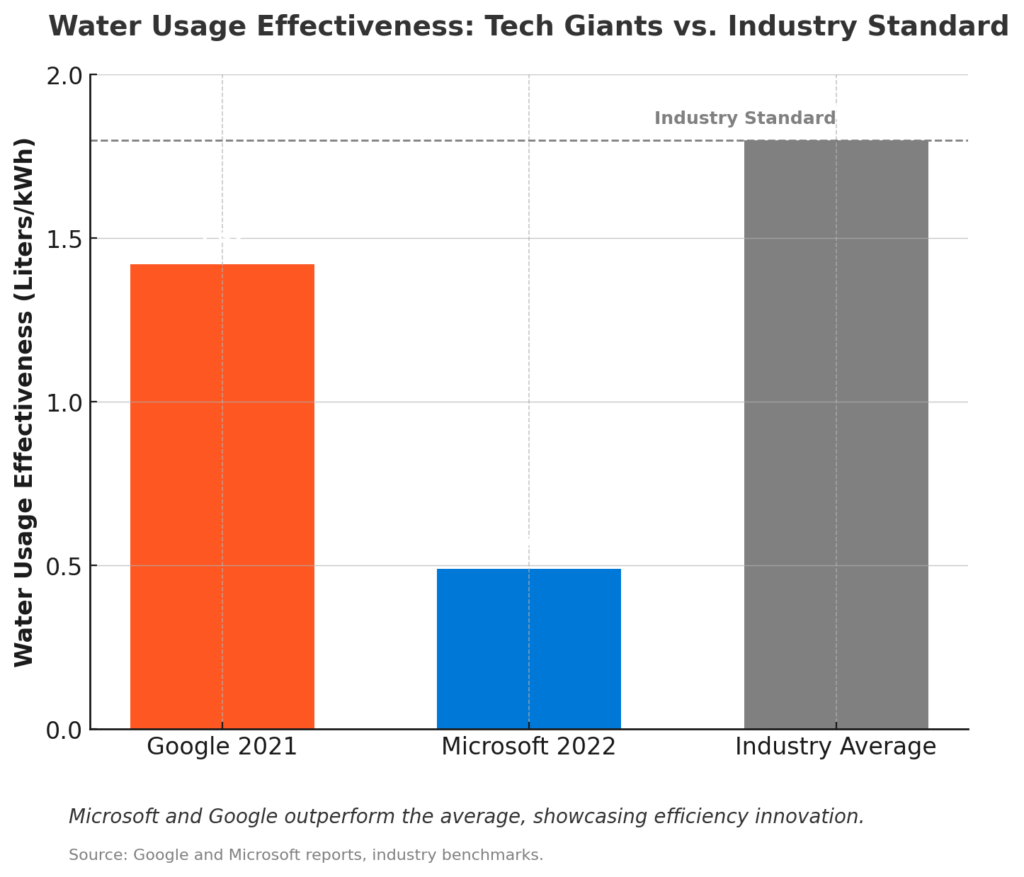
Water enters the data center equation primarily through cooling. Towers and chillers evaporate millions of liters to shed heat, a process measured by the Water Usage Effectiveness metric, or WUE. The industry average sits at 1.8 liters per kilowatt-hour of IT energy. For a facility consuming 14 million kilowatt-hours annually by its servers—a modest benchmark—that translates to 25.2 million liters of direct water use per year. It’s a staggering figure when multiplied across thousands of centers.
The mechanics are straightforward but relentless. Evaporative cooling, a common method, turns water into vapor, dissipating heat into the atmosphere. In humid climates, humidification systems add more, maintaining optimal conditions for delicate electronics. Every server rack, every computation, leaves a watery footprint.
3.2 Indirect Water Usage
The story doesn’t end there. Electricity generation itself is a water hog, especially from fossil fuels or hydropower. In the U.S., producing one kilowatt-hour typically requires 7.57 liters of water, though this varies—coal plants guzzle more, wind farms almost none. For that same 14 million kilowatt-hour data center, with a total energy draw of 21 million kilowatt-hours (assuming a PUE of 1.5), indirect water use clocks in at 159 million liters annually. That’s over six times the direct amount, a hidden toll often ignored in public discourse.
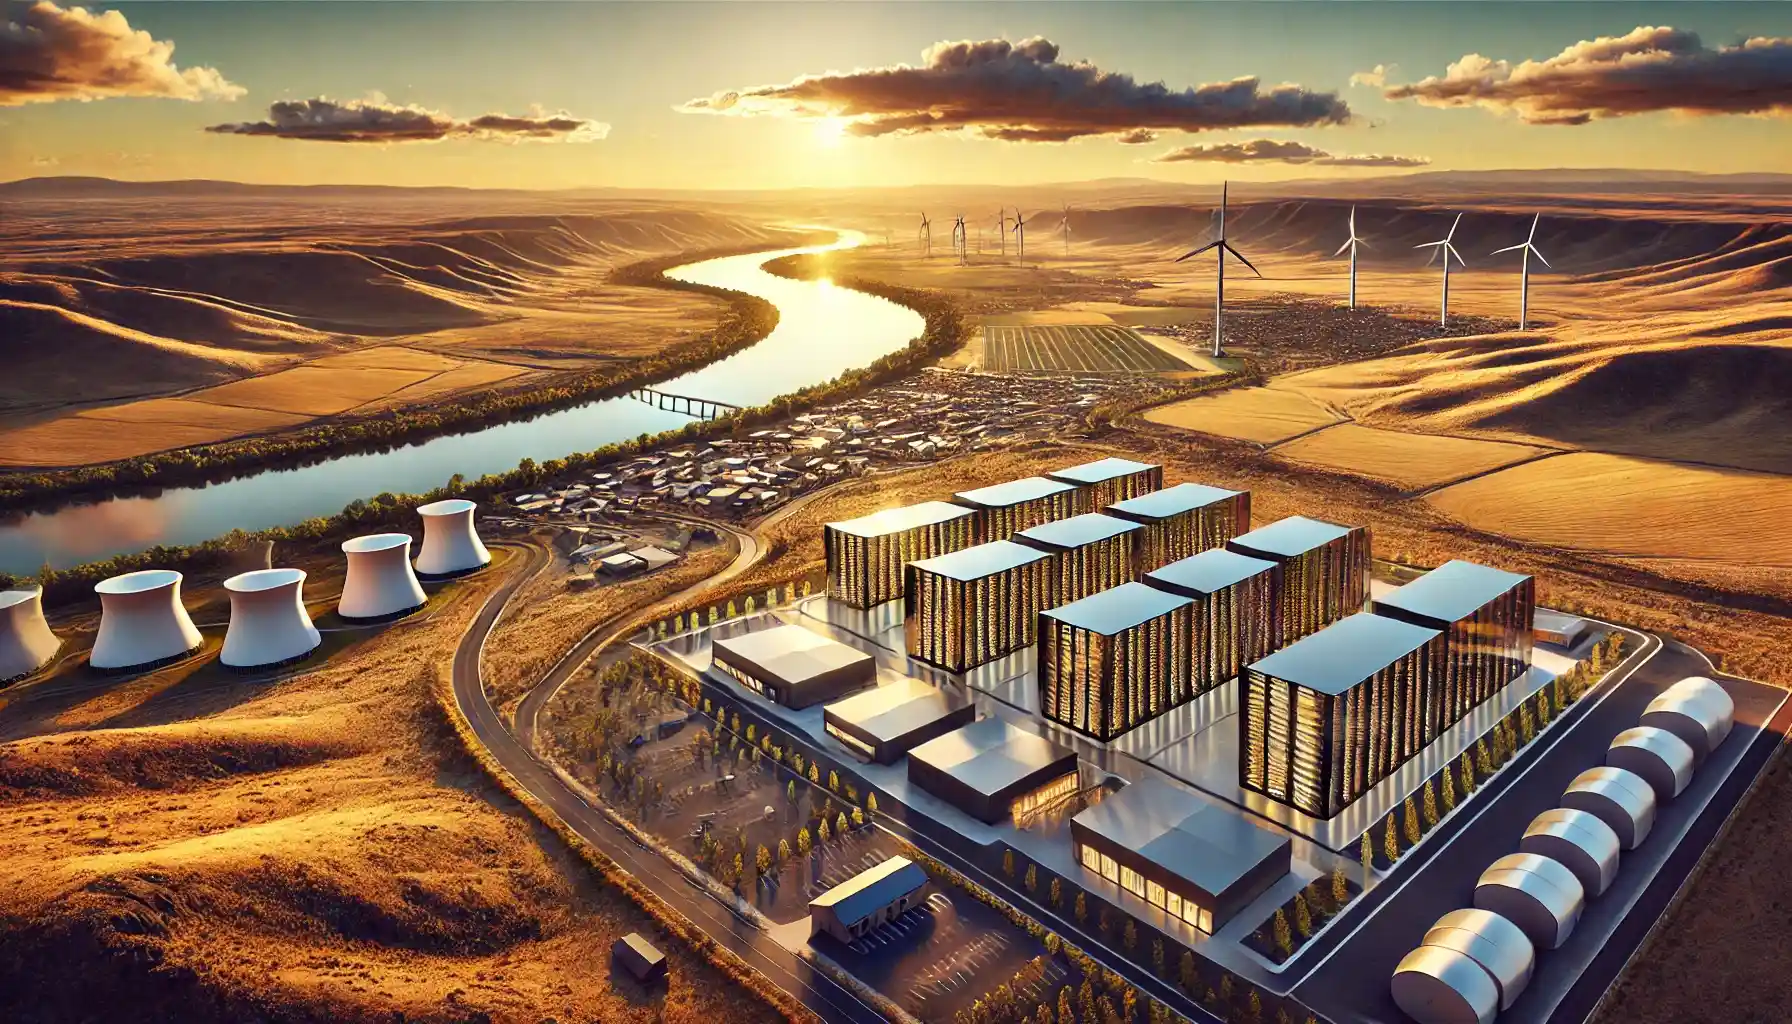
This indirect burden ties data centers to the broader energy ecosystem. A facility powered by a coal-heavy grid in Nevada carries a different water cost than one tapping hydroelectric dams in Washington. It’s a ripple effect with local consequences.
3.3 Total Water Usage and Case Studies
Add it up, and the numbers stun. In 2014, U.S. data centers consumed 626 billion liters of water, blending direct and indirect use, per AKCP estimates. That’s enough to fill 250,000 Olympic-sized swimming pools. Google’s global operations used 4.3 billion gallons (16.3 billion liters) in 2021, boasting a WUE of 1.42 liters per kilowatt-hour—below average, thanks to efficiency tweaks. Microsoft, meanwhile, reported 1.7 billion gallons in 2022, with a WUE of 0.49 liters per kilowatt-hour, showcasing how innovation can slash usage.
These giants set benchmarks, but smaller operators lag, often lacking the capital or incentive to optimize. Across the board, water remains a silent partner in the digital revolution—one that’s increasingly hard to overlook.
3.4 Factors Influencing Water Usage
Cooling technology dictates much of the variation. Evaporative systems thrive on water, while liquid cooling with recirculation sips less. Climate matters too—arid regions like the American Southwest amplify water stress, where every liter withdrawn strains municipal supplies. Access to non-potable sources, like treated wastewater, can ease the load, a tactic Google employs in drought-prone areas. Yet in water-rich zones, operators may not bother, letting consumption climb unchecked.
4. Efficiency Strategies and Current Trends
4.1 Energy Efficiency Innovations
The push for greener data centers is palpable. Liquid cooling, already a game-changer, is scaling up, with companies like Submer pioneering immersion systems that dunk servers in dielectric fluid. Free cooling shines in northern latitudes, where firms like Lenovo harness frigid air to slash energy bills. Efficient hardware—think ARM-based processors—cuts IT demand, while renewable energy contracts, now standard among hyperscalers, decarbonize the power supply.
These aren’t pilot projects—they’re mainstream. Amazon’s renewable portfolio powers millions of server hours, and Microsoft’s underwater data center experiments hint at a future where oceans double as coolants. The momentum is clear, if not yet universal.
4.2 Water Efficiency Approaches
Water-saving tactics are catching up. Recycling systems capture and reuse cooling water, trimming freshwater needs. Non-potable sources—greywater, rainwater, or treated sewage—substitute where feasible, a lifeline in parched regions. Real-time monitoring, powered by sensors and AI, fine-tunes usage, ensuring not a drop is wasted. Microsoft’s low WUE reflects such precision, a model others could follow.
Implementation varies. Google’s Georgia facilities tap recycled water, while desert-bound centers in Nevada lean on evaporation, weighing energy savings against water loss. The choice often hinges on local realities.
4.3 Current Trends
Regulation is tightening. Governments, eyeing climate goals, are nudging operators toward transparency and efficiency—think California’s water-use mandates or the EU’s energy standards. AI’s rise fuels consumption but also innovation, with hyperscale designs optimizing both resources. Disclosure is improving too—Google and Microsoft now publish water metrics, though smaller firms remain opaque, especially in water-stressed zones where scrutiny is fiercest.
The tension is tangible. Growth is inevitable, but so is the pushback from communities and regulators demanding accountability. The industry stands at a crossroads.
5. Comparative Analysis and Trade-offs
5.1 Energy vs. Water Efficiency Trade-offs
Here’s the rub: saving energy can cost water, and vice versa. Evaporative cooling, energy-efficient in hot climates, evaporates vast quantities—think millions of liters annually for a mid-sized facility. Air cooling, conversely, spares water but ramps up electricity, especially in summer. Operators must weigh these trade-offs, often dictated by geography. A data center in Phoenix might prioritize energy savings; one in Oregon might lean toward water conservation.
The math gets messy. Boosting PUE might spike WUE, and vice versa. It’s a balancing act with no universal answer, only local ones.
5.2 Location Strategies
Location is destiny. Siting a data center near renewable energy—say, Iowa’s wind farms—cuts carbon and indirect water use. Proximity to water-rich areas, like the Pacific Northwest, eases cooling demands. Studies suggest strategic placement could slash water stress by 90% and emissions by 55%, per Data Center Dynamics. Iceland’s renewable-powered, naturally cooled centers are a gold standard, but not every firm can relocate.
The catch? Prime spots are finite, and moving risks latency—milliseconds matter in cloud computing. It’s a puzzle with high stakes.
5.3 Detailed Metrics and Calculations
Consider an average U.S. data center from 2014: total energy use of 14 million kilowatt-hours, IT consumption of 9.33 million kilowatt-hours (PUE 1.5), direct water use of 16.8 million liters (WUE 1.8), and indirect water use of 106 million liters (7.57 liters per kilowatt-hour). Total water footprint: 122.8 million liters annually. Scaled across 5,000 U.S. facilities, that’s 614 billion liters—close to the 626 billion reported. These figures, grounded in industry data, underscore the dual burden.
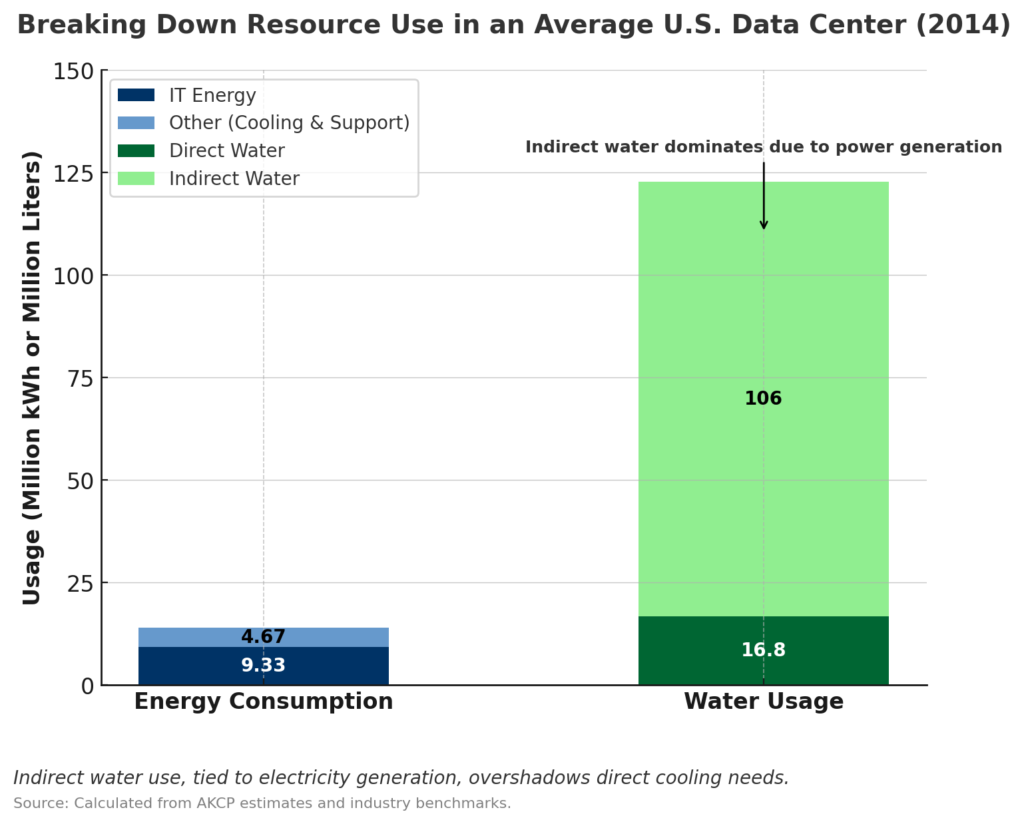
An average U.S. data center in 2014 consumed 14 million kilowatt-hours of energy—split between 9.33 million for IT and 4.67 million for cooling and support. But its water footprint dwarfed expectations: 122.8 million liters, with just 16.8 million used directly for cooling. The real burden—106 million liters—came indirectly, tied to the water-intensive process of generating electricity. As the stacked bars reveal, this unseen demand overshadows on-site use, exposing a critical link between power grids and water scarcity that operators can no longer ignore.
| Metric | Value (Average U.S. Data Center, 2014) |
|---|---|
| Total Energy Consumption | 14 million kWh/year |
| IT Energy Consumption | 9.33 million kWh/year |
| Direct Water Usage | 16.8 million liters/year |
| Indirect Water Usage | 106 million liters/year |
| Total Water Usage | 122.8 million liters/year |
6. Conclusion and Recommendations
6.1 Summary of Findings
Data centers are a paradox—indispensable yet resource-hungry. Energy use is soaring, water consumption is climbing, and the drivers—AI, cloud growth, digital dependency—show no signs of slowing. Efficiency gains have bought time, but the clock is ticking. Indirect water use, tied to power generation, often overshadows direct cooling, a nuance that demands broader awareness.
6.2 Recommendations for Sustainability
The path forward is multifaceted. Operators should double down on liquid cooling and renewables, pairing them with water recycling where possible. Governments could incentivize green retrofits and enforce usage reporting, leveling the playing field. Consumers, too, can demand transparency from tech providers, nudging the market toward accountability.
6.3 Future Research Directions
Gaps remain. Long-term climate impacts—say, how droughts might throttle cooling—are underexplored. So is the full potential of edge computing to decentralize demand. More data, especially from smaller operators, would sharpen the picture. The story is far from over.
7. Appendices
7.1 Glossary of Technical Terms
- PUE (Power Usage Effectiveness): Ratio of total energy to IT energy; lower is better.
- WUE (Water Usage Effectiveness): Liters of water per kilowatt-hour of IT energy.
- Water Stress Factor (WSF): Measure of local water scarcity impact.
7.2 Detailed Calculation Examples
For 2014’s 70 billion kilowatt-hours across 5,000 U.S. data centers: IT energy (46.7 billion kWh at PUE 1.5) yields 84 billion liters direct water (WUE 1.8), plus 530 billion liters indirect (7.57 L/kWh), totaling 614 billion liters—near the 626 billion reported.
7.3 References
For further reading and to explore the companies driving this revolution:
- United States Data Center Energy Usage Report – Lawrence Berkeley National Laboratory’s foundational study.
- Global Data Center Electricity Use to Double by 2026 – IEA’s latest projections.
- DOE Report on Data Center Energy Demand – U.S. Department of Energy insights.
- Google’s Climate-Conscious Cooling – Google’s water and energy strategy.
- Microsoft’s Water Usage Sustainability – Microsoft’s efficiency metrics.
- Data Center Water Usage Guide – Comprehensive industry overview.
FAQ
Q: How much energy do data centers use annually in the U.S.?
A: As of recent estimates, U.S. data centers consume around 100 billion kilowatt-hours per year, or 2-3% of national electricity, with projections suggesting a potential tripling by 2028.Q: What is the primary use of water in data centers?
A: Water is mainly used for cooling, either through evaporative towers or liquid systems, with an industry average of 1.8 liters per kilowatt-hour of IT energy consumed.Q: Why does electricity generation affect water usage?
A: Producing electricity, especially from fossil fuels or hydropower, requires significant water—about 7.57 liters per kilowatt-hour in the U.S.—adding an indirect water cost to data centers.Q: Can data centers reduce their environmental impact?
A: Yes, through liquid cooling, renewable energy, water recycling, and strategic siting near sustainable resources, though implementation varies by operator and region.Q: Are tech companies transparent about their usage?
A: Leaders like Google and Microsoft publish energy and water metrics, but smaller firms often don’t, especially in water-stressed areas where disclosure is most needed.